Interpreting rental vacancy rates for small and midsize cities


May 8, 2024
By Alisa Hartwell
Overview
This brief provides an overview of how rental vacancy rates are calculated and identifies challenges and opportunities for small and midsize cities in accessing and using vacancy information from the U.S. Census. Using the example of Roanoke, VA, we explore how using the most recent American Community Survey (ACS) five-year estimates can suggest a starkly different rental vacancy rate than using one-year estimates, highlighting the potential value in using ACS one-year estimates when they are available and reliable.
While the Housing Solutions Lab’s Housing Needs Assessment Tool relies on ACS five-year estimates to calculate vacancy rates, this brief offers guidance on how to supplement that information with one-year ACS data, and options for other possible data sources to calculate timely vacancy rates.
Vacancy rates indicate the proportion of housing inventory available to be rented or sold. High vacancy rates can be a symptom of declining demand for housing and lead to a decrease in asking rent or sales prices. Conversely, areas with low vacancy rates may have insufficient housing to meet community needs. If low vacancy persists, the market may respond by pushing prices upward over time. The “natural” vacancy rate at which prices remain steady varies by location but is generally estimated to be about 7 to 8 percent.
Historical context
Many municipalities are facing historically low vacancy rates. Small and midsize cities in particular (defined as census places with populations between 50,000 and 500,000) have seen their rental vacancy rates decline from an average of 7.1 percent in 2012 to only 5.2 percent in 2022, based on five-year ACS estimates. The average small or midsize city saw their rental vacancy drop by about 2 percentage points during this time, but some saw much larger drops (such as Mobile, AL, where rental vacancy fell from about 10 percent to 5 percent, or Pittsburgh, PA, where it fell from 6.8 percent to less than 2 percent).
Seasonality
Many jurisdictions are also grappling with a rise in short-term rentals. Depending on the city, units earmarked for “seasonal, recreational, or occasional use” can comprise most vacant units, exceeding the number of units vacant and available for rent. Units for occasional use are generally excluded from the calculations for homeowner or rental vacancy rates because they are often only “used or intended for use” for specific seasons, weeks, or occasions throughout the year, and their vacancy rates could vary widely depending on data collection dates.
Calculation
Vacant housing units can be broken down into several subcategories:
- For rent
- Rented, not occupied
- For sale only
- Sold, not occupied
- For seasonal, recreational, or occasional use
- For migrant workers
- Other vacant
Generally, units counted as vacant are unoccupied and available for rent or sale. As of 2023, ACS estimates vacant units are stored in table B25004: Vacancy Status, while occupied unit estimates for both renters and homeowners can be found in B25003: Tenure on the U.S. Census Bureau’s data portal.
Homeowner vacancy rate
The homeowner vacancy rate can be calculated with the following formula:
The numerator for this formula is the number of vacant units up for sale, while the denominator is any unit that could be owner-occupied. The ACS defines this as the sum of owner-occupied units, the vacant units up for sale, and the vacant units that have been sold but not yet occupied by their owner.
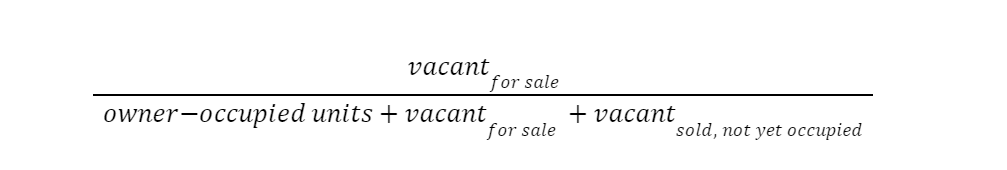
Rental vacancy rate
The ACS calculates rental vacancy rates with this formula:

This formula is very similar in form to the homeowner vacancy rate: the number of vacant units for rent divided by the sum of any unit that could ever be considered renter-occupied. Note that neither of these estimates include units marked for seasonal, recreational, or occasional use; units for migrant workers; or other vacant units.
Challenges interpreting vacancy rates for small and midsize cities
Rental and homeowner vacancy rates are readily available through the ACS’s Selected Housing Characteristics table. However, the survey’s timing and sample size can limit the usefulness of these estimates, especially in small and midsize cities. First, there is an 18-month lag between data collection and publishing for the ACS, which means that estimates can quickly become out-of-date or irrelevant in fast-changing markets. In localities with populations of 65,000 and below, only five-year estimates are available, creating an even longer lag time.
Second, because the ACS is a survey (in 2022, the survey captured about 2 million housing units out of 144 million units nationwide), it generates estimates with margins of error. Vacancy rates for smaller geographies have higher margins of error and, as a result, are less reliable. In more than 70 small and midsize cities – places like Oak Lawn, IL, and The Woodlands, TX – even five-year estimates for rental vacancy had margins of error of 3 percentage points or greater, meaning that an estimated vacancy rate of 7 percent could actually be as low as 4 or as high as 10 percent.
Vacancy rate example
Roanoke’s population was 97,847, large enough to meet the threshold for providing ACS one-year estimates. Let’s compare the various vacancy rates and margins of error for both one-year and five-year ACS data:
ACS five-year data
Generally, ACS five-year data is a go-to data source for small and midsize cities, given its availability regardless of city size. ACS five-year estimates are conglomerations of samples taken for a specific geographic area over a five-year period. ACS five-year data released in 2022, for example, consists of data points taken not only in 2022, but also in 2021, 2020, 2019, and 2018. The ACS aggregates information this way because, although combining samples across years can result in time-lagged data, it can increase the likelihood that the estimate is accurate and has smaller margins of error.
Margins of error
Estimates provided by the ACS include a margin of error, which captures the level of uncertainty with a sampling estimate. As an example, the 2018-2022 ACS five-year estimates showed Roanoke had a 9 percent rental vacancy rate and a 1.7 percentage point margin of error. How should the margin of error be interpreted? The American Community Survey generally uses a 90 percent confidence interval for its margins of error, suggesting there is a 90 percent chance that the true rental vacancy rate for Roanoke is in this range:
Lower bound: 9.0% – 1.7 = 7.3%
Upper bound: 9.0% + 1.7 = 10.7%
The graph below shows how ACS five-year vacancy rates have changed for Roanoke from 2013-2017 estimates to 2018-2022 estimates. The error bars on the graph show that the margin of uncertainty was larger in 2022 than in 2017.
Figure 1.
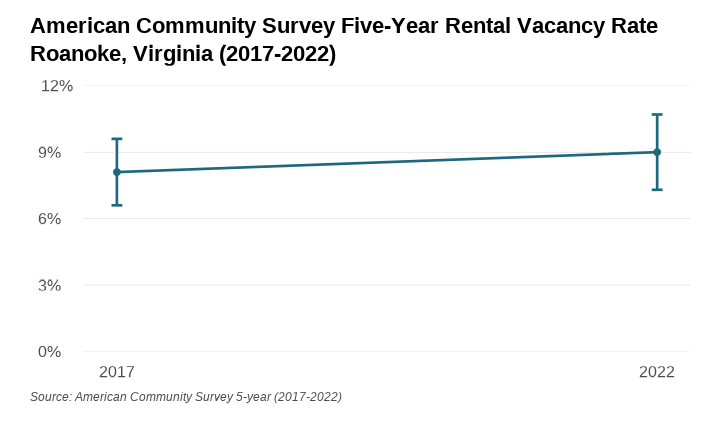
Looking at ACS five-year data, the estimated rental vacancy rate in Roanoke increased from about 7 percent to 10 percent between 2013-2017 and 2018-2022. However, because the upper bound of the 2017 margin of error overlaps with the lower bound of the 2022 margin of error, it is also possible that the vacancy rate did not change at all. (Note that when examining ACS five-year estimates over time, it’s best practice to compare data points with no overlap.)
ACS one-year data
ACS one-year estimates are composed of sampling data from a single year and are therefore more timely than five-year estimates. But because fewer data points are used to calculate them, ACS one-year estimates also generally have larger margins of error. Finally, because ACS one-year estimates are only available for jurisdictions with populations greater than 65,000 people, they are less widely available for small and midsize cities.
With that in mind, what can one-year rental vacancy rates for Roanoke from 2013 to 2022 tell us? (Note that there are no ACS one-year estimates for 2020 due to data collection constraints during the pandemic.)
Figure 2.

Take note of the error bars on the graph above, which are much larger compared to the five-year estimates. A perk of ACS one-year estimates is that they are released several months before five-year estimates each year. ACS one-year estimates for 2022 were released in October 2023, whereas five-year estimates were not available until December 2023. According to these estimates, Roanoke’s rental vacancy rate fell considerably to 3.4 percent, with a margin of error of 2.3 percentage points. Even after taking a larger margin of error into consideration, this indicates that Roanoke’s rental vacancy rate decreased drastically between 2021 and 2022, which is a very different conclusion than you might draw from looking at the most recent ACS five-year estimates.
Conclusion
The best data to look at for vacancy rates vary considerably based on local circumstances, especially with recent seismic shifts in the housing market. For areas with high margins of error or no ACS one-year estimates, there are other potential sources of vacancy information, including United States Postal Service (USPS) vacancy data, local utilities data, or data from private companies. But for any municipality, examining nationally available data sources – and understanding their potential shortcomings – is a good starting point in assessing vacancy.